✅ What is debugger?
The debugger is a built-in JavaScript keyword that tells the browser to pause the execution of your script at that specific line, as if you placed a breakpoint manually in the browser's developer tools.
When the debugger statement is encountered:
JavaScript pauses execution
The browser opens the debugger (DevTools) automatically
You can inspect variables, step through code line by line, and understand the program flow
🧪 Syntax
debugger;It doesn’t require any arguments or return anything.
🎯 Why Use debugger?
Helps inspect values of variables at a specific point
Step through code execution line by line
Understand complex logic, loops, or conditions
Debug errors or unexpected behavior more precisely than
console.log()
🧩 How It Works – With Example
✅ Example:
<!DOCTYPE html>
<html>
<head>
  <title>Debugger Example</title>
</head>
<body>

<h2>Check the Developer Console (F12)</h2>

<script>
  let a = 5;
  let b = 10;
  let sum = a + b;

  debugger;  // Code execution will pause here

  let message = "Sum is: " + sum;
  console.log(message);
</script>

</body>
</html>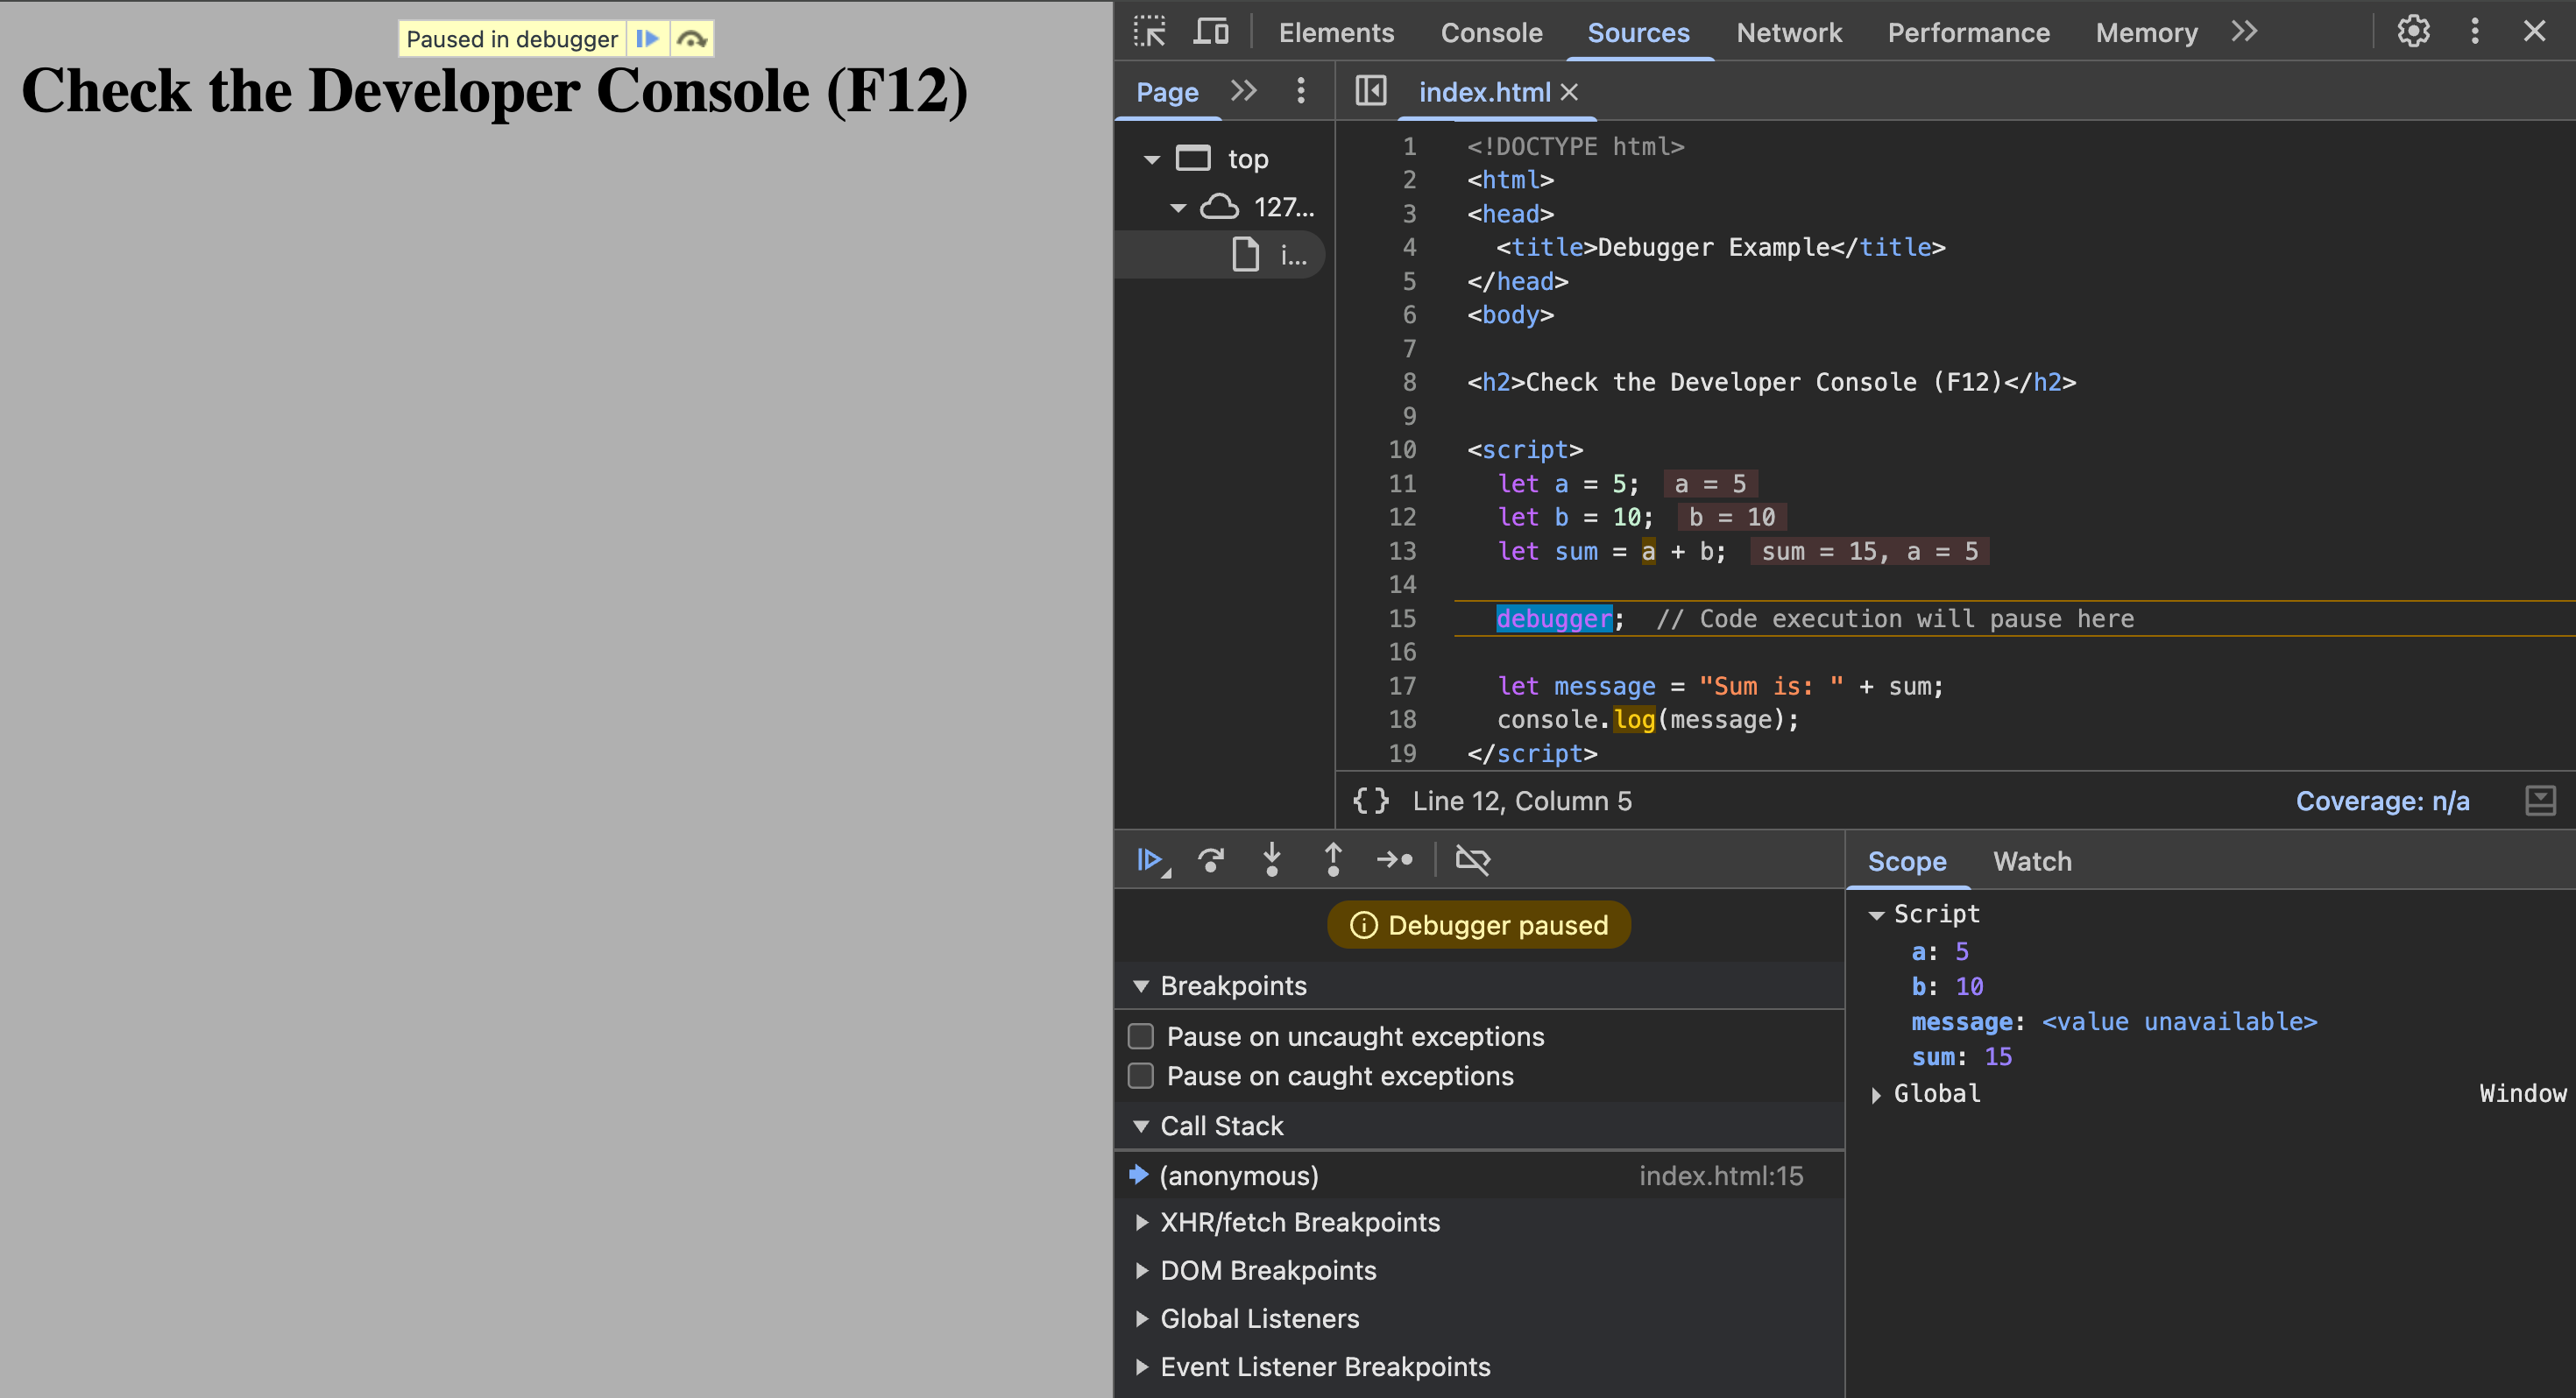
🖥️ What Happens:
When the browser hits
debugger;, it will pause the script.You’ll see the code editor inside DevTools, right at that line.
You can:
Hover over variables like
a,b,sumUse the Console to try expressions (e.g.,
a * b)Press F10 (Step Over) or F11 (Step Into) to continue line by line
🔍 Where to Use debugger
Use Case | How |
|---|---|
Unexpected output | Pause before/after the logic and inspect variable values |
Inside loops or conditionals | Check if they are working as expected |
Inside function execution | Trace how functions receive and return values |
When try-catch blocks hide errors | Step inside to find the source of exceptions |
During form validation or DOM updates | See how the page reacts when users interact |
🧠 Tip: Combine with Conditions
You can make debugging smarter:
if (user.role === 'admin') {
  debugger;
}
This way, the pause only happens for specific conditions.
🛑 Important Notes
debuggeronly works when DevTools are open.Browsers ignore
debuggerif DevTools are closed.Don’t leave
debuggerin production code – it will pause execution for users if left accidentally.
✅ Comparison: debugger vs console.log()
Feature |
|
|
|---|---|---|
Shows variable value | ✅ Yes | ✅ Yes (on hover or in Scope panel) |
Pauses execution | ❌ No | ✅ Yes |
Step through code | ❌ No | ✅ Yes |
Breaks on conditions | ❌ (needs manual if) | ✅ (can be inside conditions) |
Performance impact | Minimal (but should clean up) | None (ignored unless DevTools open) |
🚫 Example of Bad Use (don’t leave in production)
function initApp() {
  debugger; // ⚠️ remove before publishing
  // app initialization logic
}
Use it only while debugging locally.
✅ Best Practices
Use
debuggerin complex logic areas instead of sprinkling manyconsole.log()callsCombine with browser DevTools to watch variables and call stack
Always remove or comment out
debuggerlines before deploying.