🧑💻 Learning DevTools
Chrome DevTools offers powerful visualization and debugging tools that streamline web development. The following guide integrates illustrative images to enhance understanding and aesthetics.
✅ Opening DevTools: Multiple Access Points
Right-click on any website → select Inspect to open DevTools.
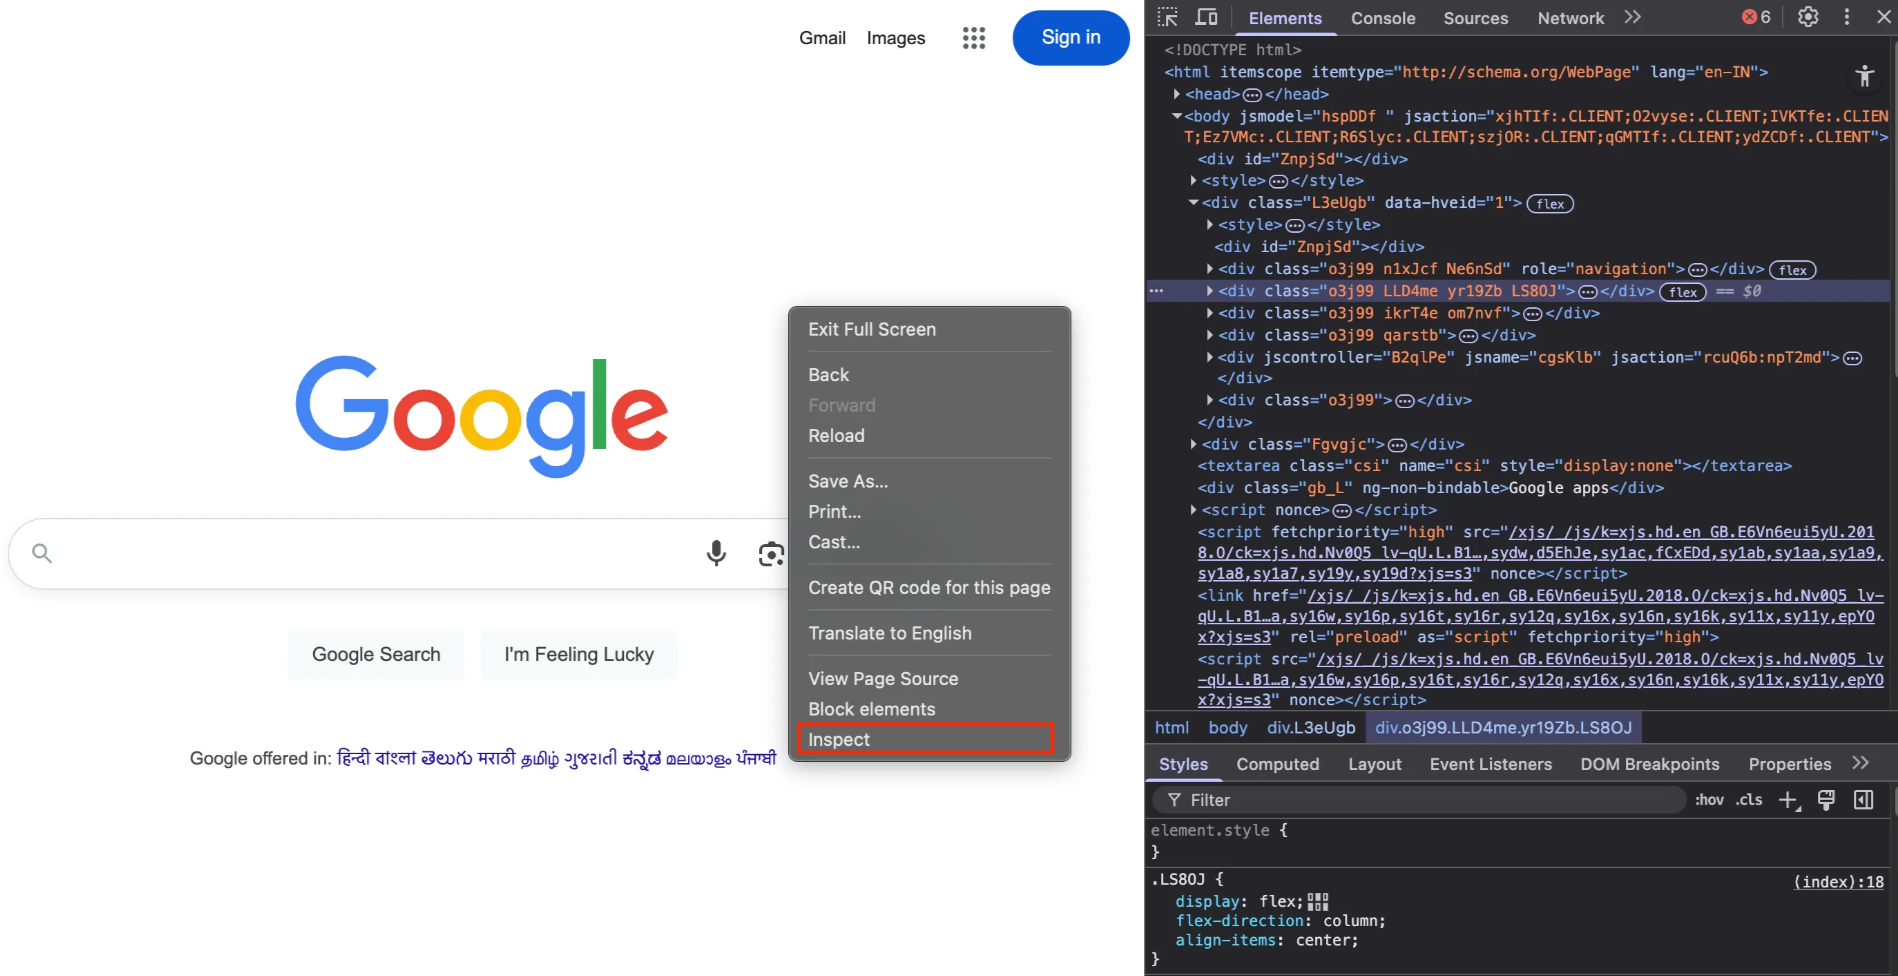
❗️Quick Access Methods
Windows/Linux: Ctrl+Shift+I or F12
Mac: Cmd+Option+I
Menu: ⋮ → More Tools → Developer Tools
Element picker: Ctrl+Shift+C (Windows) / Cmd+Option+C (Mac)
✏️The Box Model: Visualizing Element Structure
Inspect an element and view the Computed tab to reveal the box model diagram:
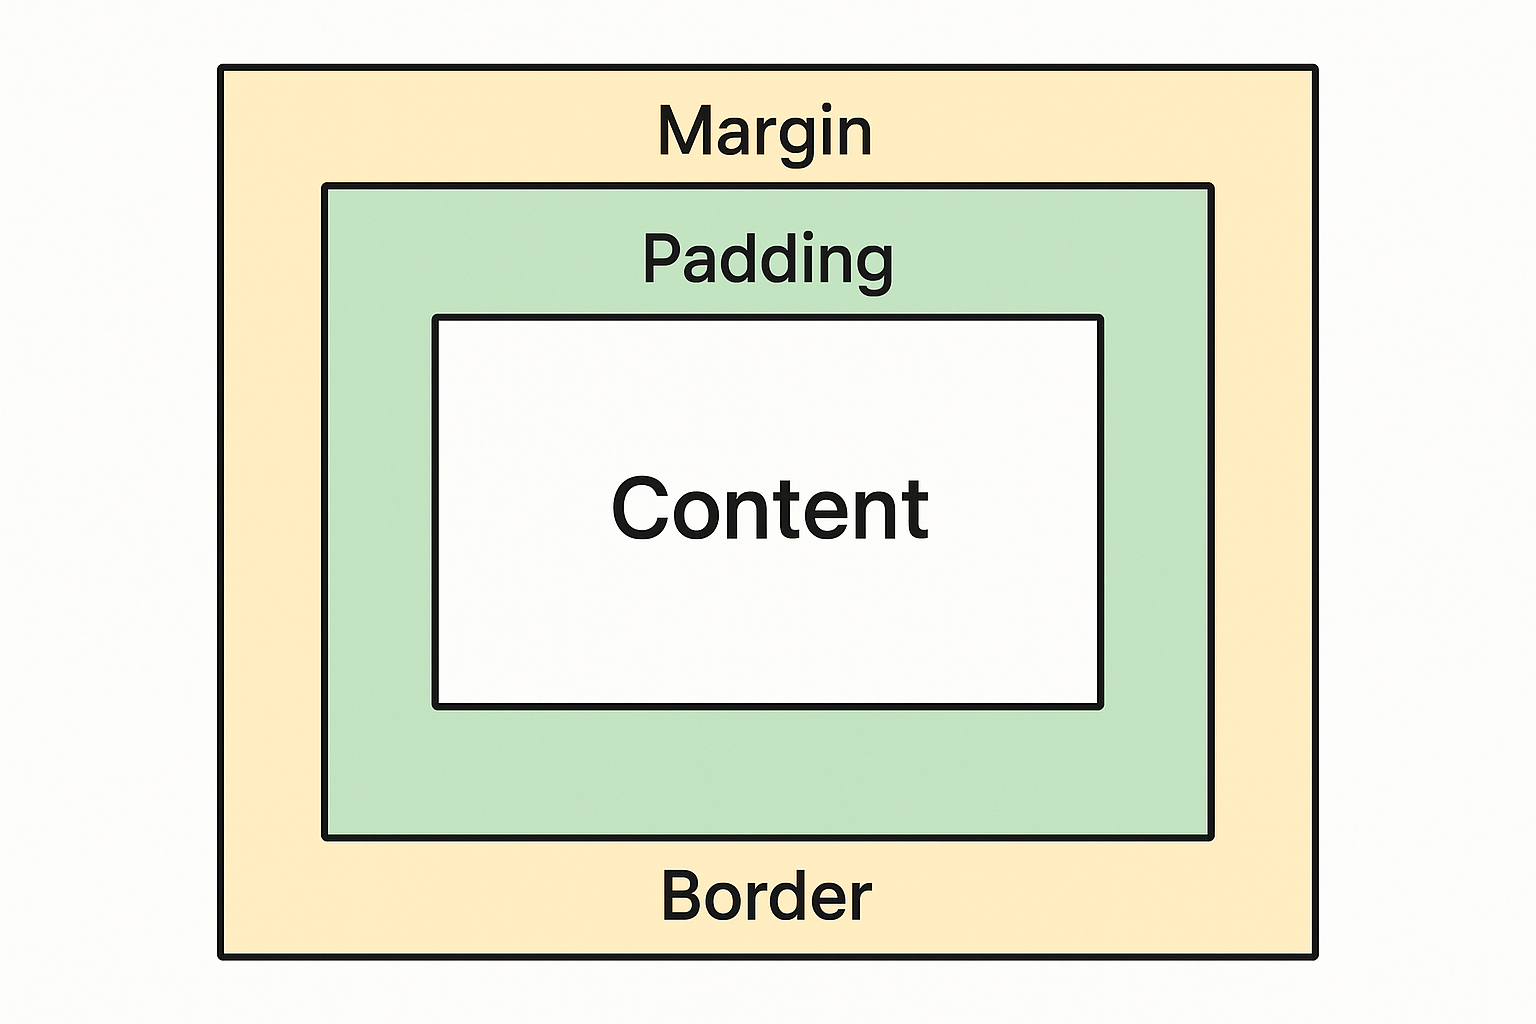
Interactive box model diagram in the Computed tab
❗️Components:
Content (center)
Padding (green)
Border (yellow/orange)
Margin (orange)
Edit values directly within the diagram to test layout adjustments in real time.
🧠 CSS Debugging : Flexbox and Grid Layout Tools
Toggle the Flexbox overlay to visualize alignment, gaps, and distribution:
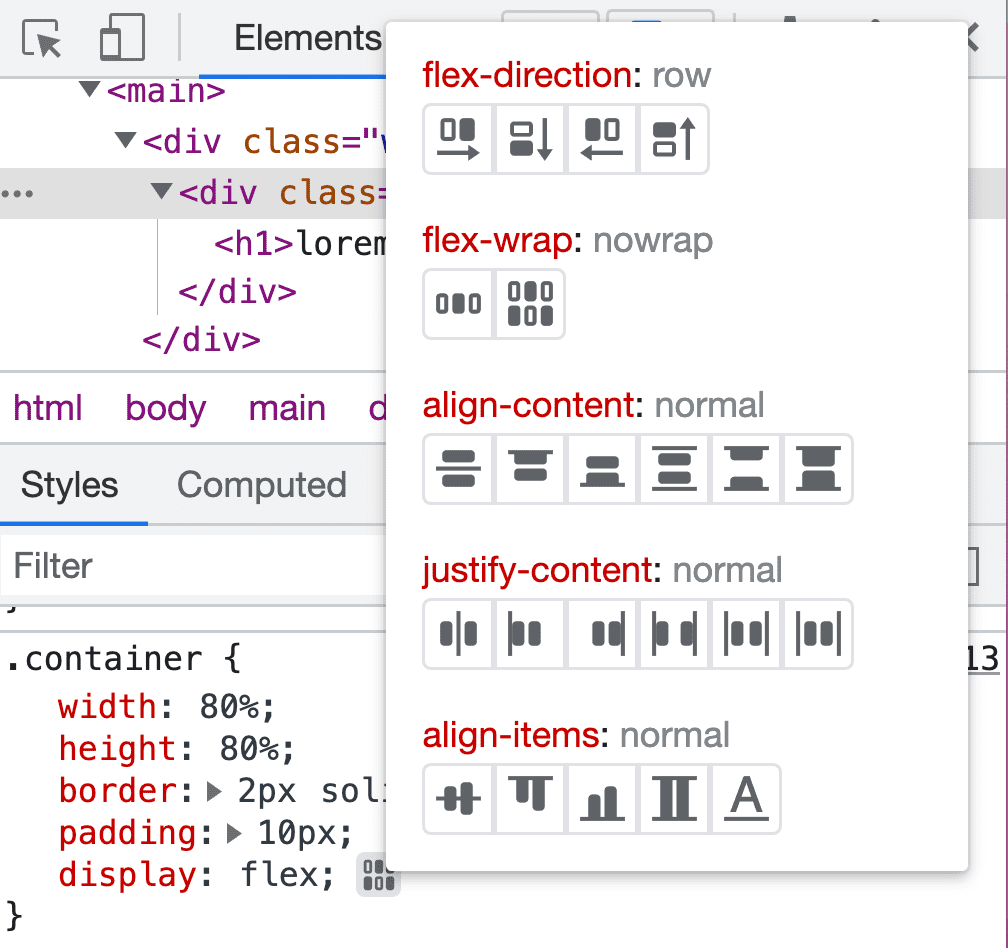
Visualizing and editing Flexbox containers
Use the Grid badge for line overlays, area names, and track sizing.
📱 Responsive Design and Device Testing
Enter Device Mode to simulate diverse screen sizes and network/CPU conditions:❗️
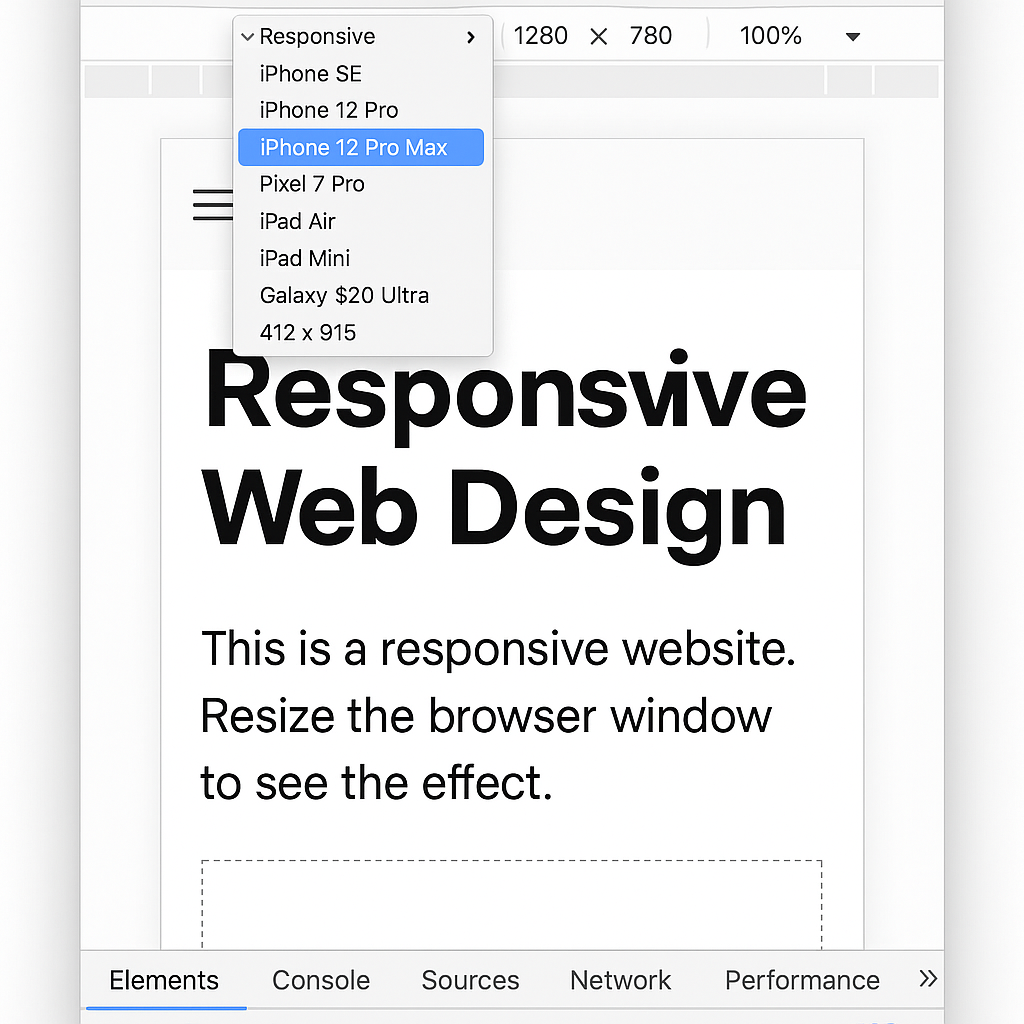
Simulating mobile and tablet viewports
❗️Features:
Preset devices (iPhone, Pixel, iPad)
Custom viewport dimensions
Touch event simulation
Throttling options
🚀 Performance Auditing with Lighthouse
Run Lighthouse audits directly in DevTools to evaluate performance, accessibility, SEO, and best practices:
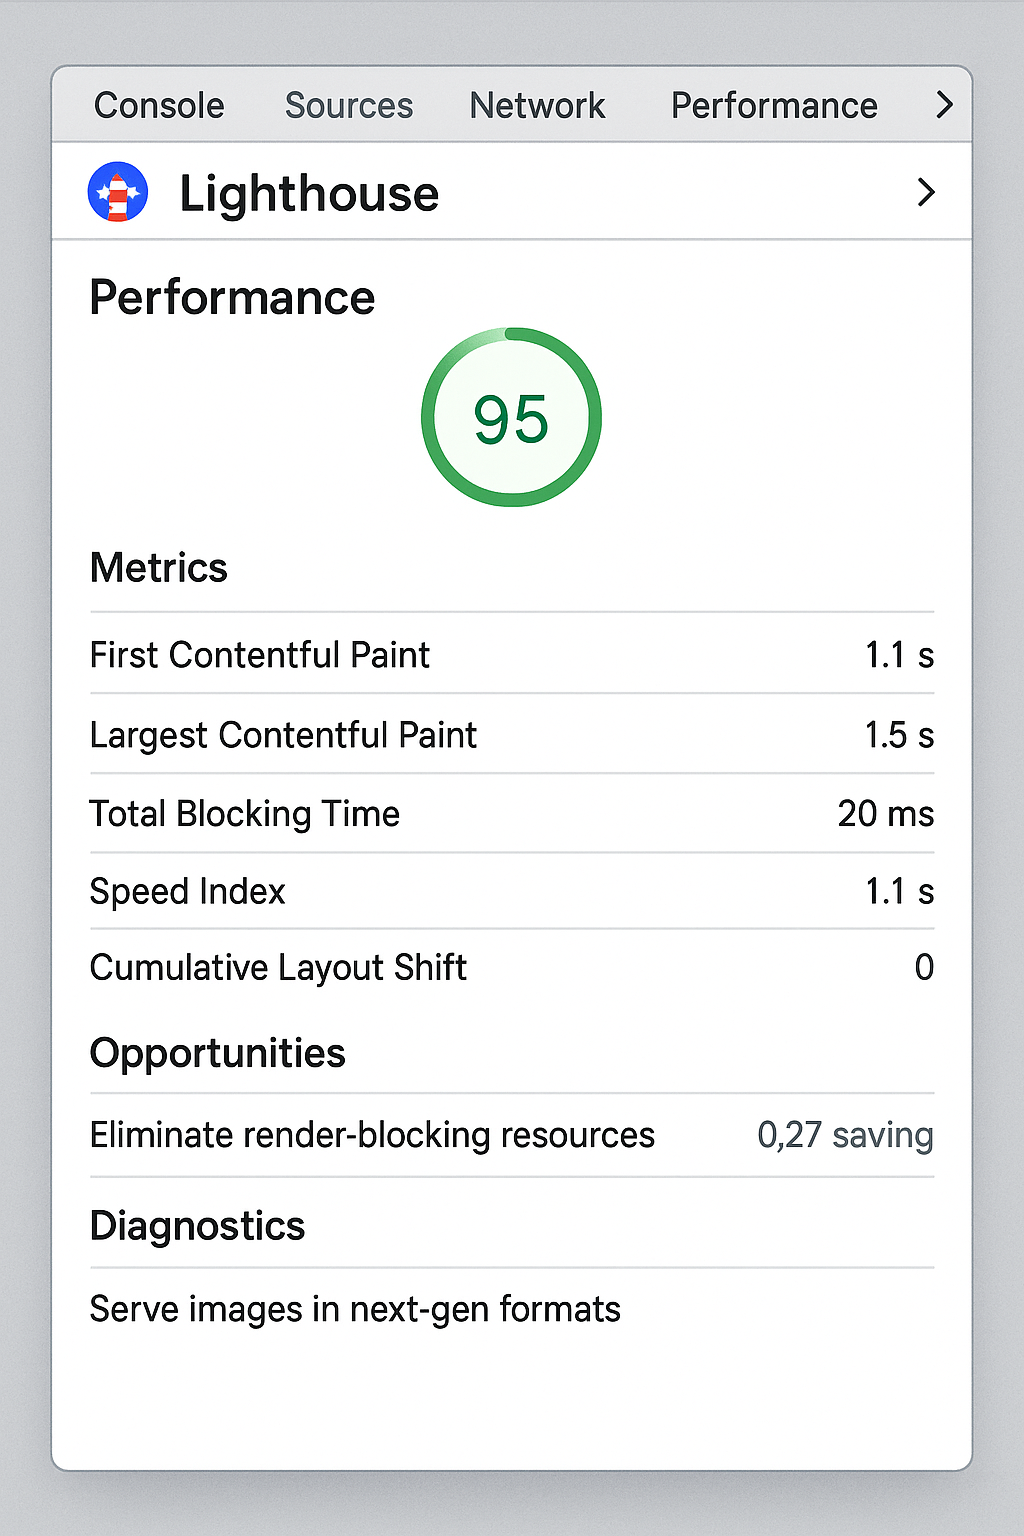
Lighthouse audit results within DevTools
Audits provide actionable recommendations to optimize Core Web Vitals (LCP, CLS, INP), accessibility compliance, and more.
By integrating these visual cues, you can navigate DevTools confidently, turning it into a dynamic extension of your development environment.